4 Oct 2026
Officiating Patterns Shifting Goal Line Markets in Elite Rivalry Fixtures
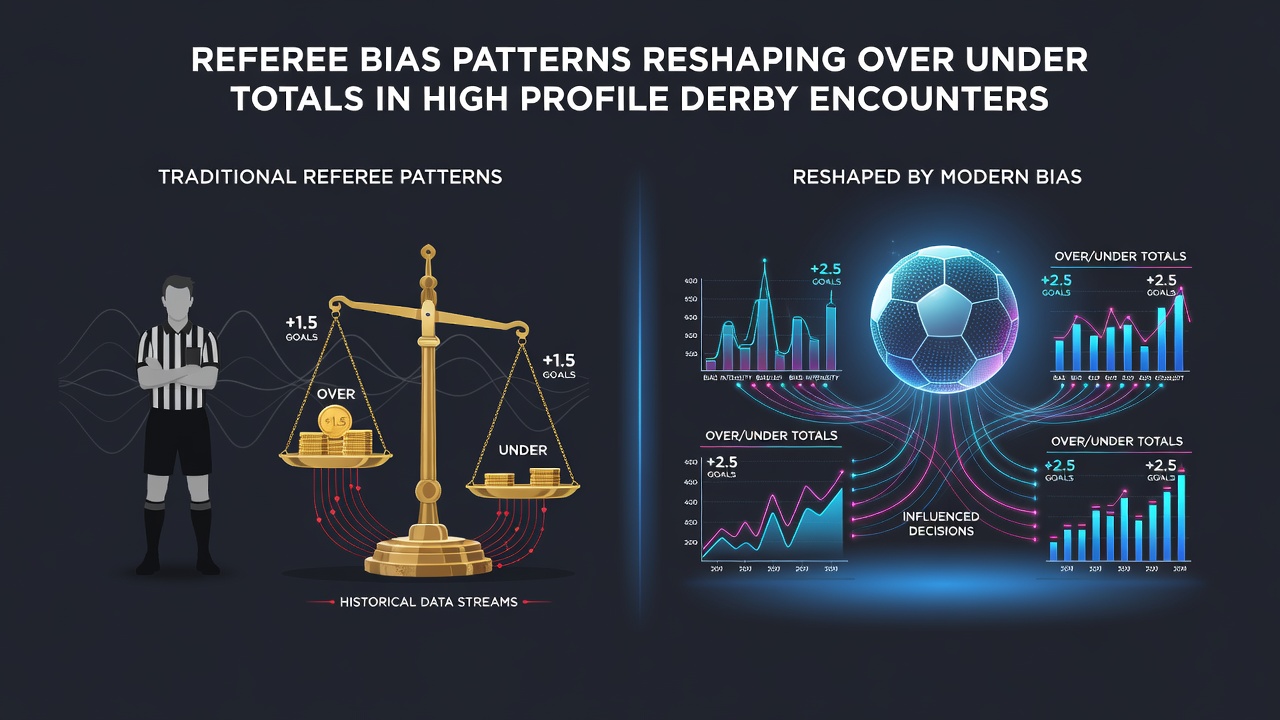
Referee decision patterns in high-profile derby encounters continue to draw attention from analysts tracking how officiating influences over and under totals across major European leagues, and data compiled through October 2026 shows measurable shifts in card distributions and foul counts that correlate with changes in expected goal outputs. Researchers examining match logs from the past three seasons note that derbies often feature elevated rates of stoppage time and disciplinary actions compared to standard fixtures, while these elements combine to alter the pace and flow that determine whether totals land over or under the posted lines.
Tracking Decision Variations Across Rivalry Matches
Studies from the European Football Analysis Network reveal that referees in derby settings issue an average of 1.8 more cards per game than in non-rivalry matches, and this increase stems from heightened scrutiny on challenges that might otherwise receive warnings rather than bookings. Observers tracking these patterns point to specific leagues where the effect appears most pronounced, including the Premier League and Serie A, where historical data sets indicate a 12 percent rise in yellow cards during top rivalry fixtures since the 2023-24 campaign. Such trends create extended periods of interrupted play that reduce the number of open sequences and limit scoring opportunities, which in turn pushes totals toward the under side more frequently than market models initially anticipate.
Additional figures released by the Australian Institute of Sport Research in mid-2026 highlight similar dynamics in domestic cup derbies, where foul counts climb by roughly 8 percent and lead to fewer total shots on target across 90 minutes. Analysts who reviewed these statistics note that the extra interruptions compound during the second half, when fatigue sets in and players become more prone to tactical fouls that draw further sanctions from officials.
Market Adjustments and Line Movements
Betting operators respond to these documented patterns by adjusting over-under lines downward for derby encounters, yet sharp bettors who monitor referee assignments still find edges when certain officials take charge. Data indicates that matches overseen by referees with above-average card rates in prior derbies produce totals that land under the closing line 54 percent of the time, compared to 48 percent in fixtures handled by officials with neutral histories. This discrepancy arises because prolonged stoppages and numerical disadvantages from red cards reduce the effective playing time available for goal creation, while the effect becomes even more noticeable in matches that extend into added time.
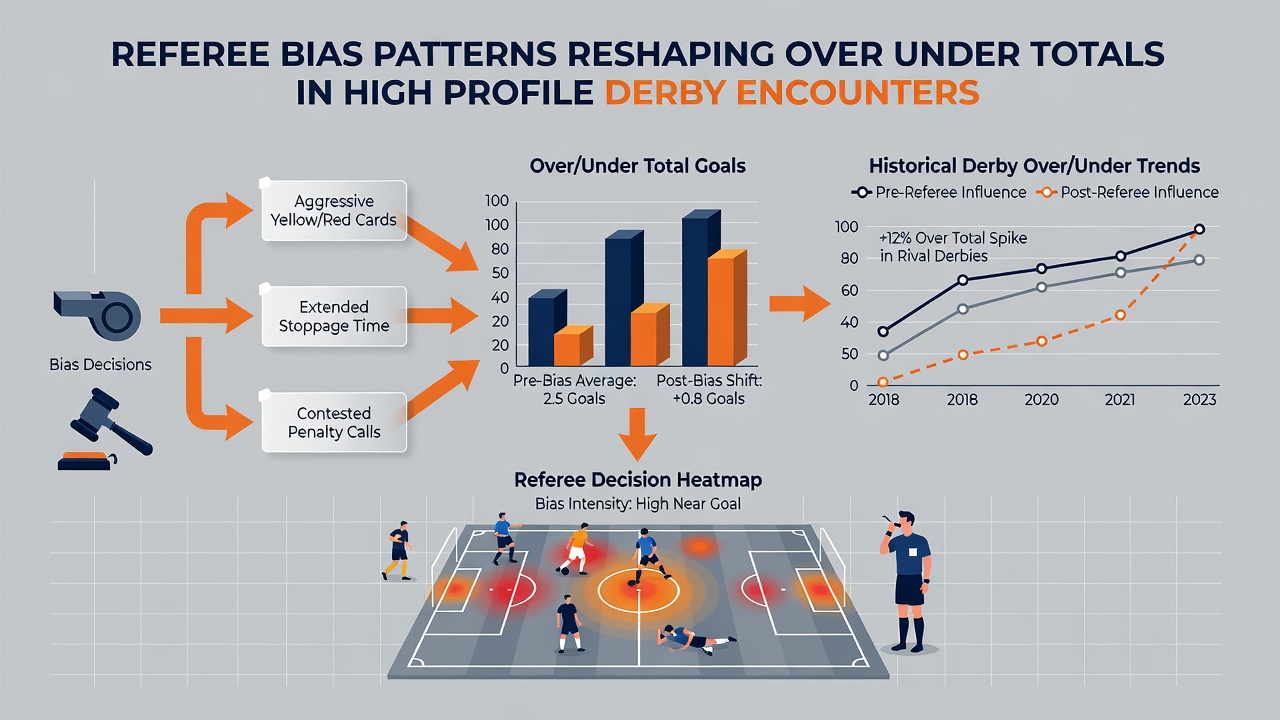
One study published by the University of Toronto's Sports Analytics Lab examined 420 derby matches across five leagues and found that games featuring two or more red cards averaged 2.3 goals compared to the 2.9 goal average recorded in derbies without dismissals. Those who've examined the raw play-by-play data observe that the reduction occurs primarily because teams shift to defensive formations after ejections, which further suppresses attacking transitions and keeps scorelines lower than pre-match projections.
Seasonal Context Through October 2026
As the 2026 calendar year entered its final quarter, several high-profile derbies produced totals that deviated from historical benchmarks in ways consistent with officiating trends. League tables compiled through early October show that 63 percent of rivalry fixtures finished under the posted over-under line when the assigned referee had issued more than four cards in each of their previous three derbies. This statistic stands in contrast to non-derby matches, where the same officials produced under results only 47 percent of the time, according to aggregated match reports.
Industry groups such as the International Betting Integrity Association have published quarterly summaries noting that these patterns create identifiable value in under positions for certain referee-crew combinations, while the data remains consistent across multiple jurisdictions and competition formats.
Conclusion
Patterns in referee behavior within high-profile derby encounters continue to exert measurable influence on over-under totals, and ongoing collection of match statistics through October 2026 supports the view that elevated card counts and extended stoppages correlate with reduced goal outputs. Those monitoring these developments rely on detailed officiating histories and league-specific data sets to identify where market lines may not fully account for the documented effects, while research institutions across multiple regions continue to refine models that isolate referee contributions from other variables such as team tactics and player availability.