22 Jun 2026
Pitchside Microclimates: How Localized Wind Patterns and Temperature Swings at Specific Stadiums Alter Ball Trajectory Data and Reshape European Handicap Calculations
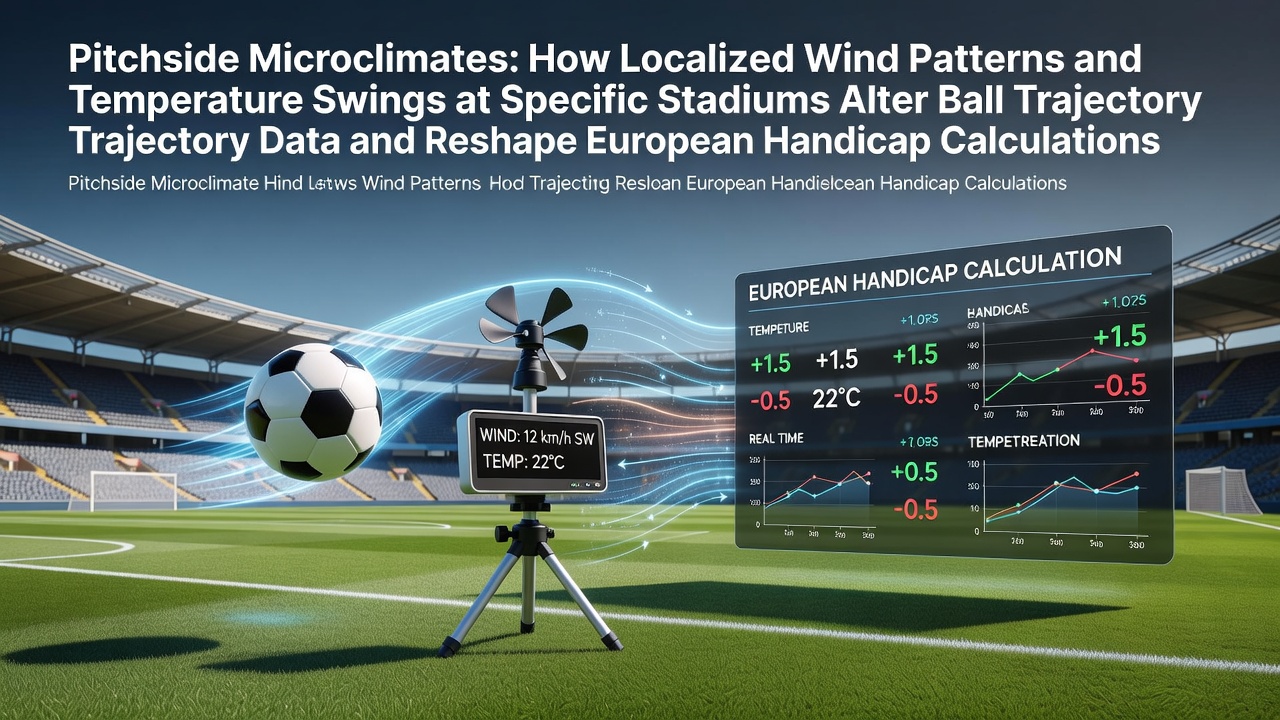
Stadiums across Europe create their own microclimates where wind patterns and temperature variations influence ball movement in ways that differ from open-field conditions and these localized effects feed directly into trajectory modeling systems used by analysts and betting markets. Researchers have documented how structures like stands and roofs generate swirling currents that alter drag and lift on the ball while temperature gradients near the pitch surface modify air density and change flight paths in measurable increments.
Wind Patterns Unique to Enclosed Venues
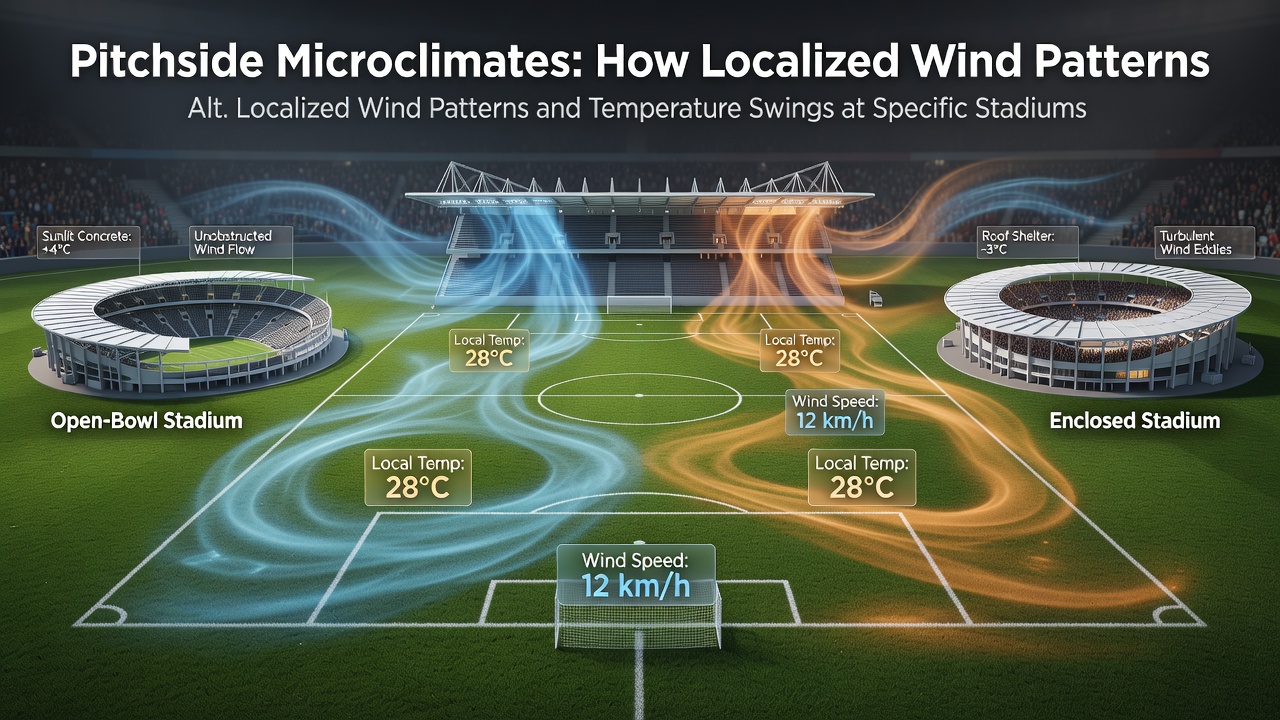
Many European grounds experience wind behaviors shaped by their architecture and surrounding geography with coastal sites like those in Portugal or the Netherlands showing consistent cross-field gusts during evening fixtures while inland arenas develop vertical updrafts from heat rising off artificial surfaces. Data collected during matches in 2025 and into June 2026 reveals that these currents can deflect a ball by up to several centimeters over a 30-meter pass which accumulates into noticeable deviations during set pieces and long-range shots. Observers note that teams playing at venues with pronounced wind tunnels adjust their delivery angles and power output accordingly and statisticians incorporate these adjustments into predictive models that inform European handicap lines.
Temperature Swings and Air Density Effects
Temperature fluctuations within a single match often exceed five degrees Celsius between the pitch surface and upper stands because concrete and metal absorb sunlight during afternoon kickoffs then radiate heat after sunset. Such swings reduce air density during warmer periods which decreases drag and allows the ball to travel farther at the same velocity while cooler intervals increase resistance and shorten range. Studies from sports science institutes in Australia and Canada have quantified these changes showing that a three-degree drop can shorten a free-kick trajectory by roughly one percent and analysts tracking European fixtures apply similar corrections when compiling datasets for handicap calculations.
Integration into Ball Trajectory Datasets
Modern tracking systems installed at top venues record wind speed humidity and temperature at multiple pitch locations every few seconds and feed the readings into algorithms that reconstruct actual ball paths. These enriched datasets reveal patterns that generic weather reports miss such as persistent eddies behind goalposts or thermal layers above center circle. European handicap models now draw on this granular information to recalibrate expected goal margins because a side accustomed to playing in stable conditions may underperform when visiting a ground with pronounced microclimate activity. Figures released by industry research groups indicate that incorporating microclimate variables has narrowed prediction errors by measurable margins in recent seasons.
Reshaping European Handicap Calculations
Handicap compilers adjust opening lines when venue-specific data shows consistent trajectory biases for example raising or lowering goal expectations at grounds where wind assists attacking play toward one end. In June 2026 several fixtures scheduled at stadiums known for evening temperature drops saw lines shift after trajectory models flagged reduced shot accuracy in the second half. Those who compile European markets reference reports from academic sources and regional sports bodies to validate the adjustments and maintain alignment with observed outcomes rather than relying solely on historical averages.
Case Examples from Recent Fixtures
One study of a northern European venue revealed that prevailing winds created a low-pressure zone near the south stand corner flag which repeatedly pushed inswinging corners wide of the near post during twilight matches. Another analysis of a southern ground documented how afternoon heat buildup increased ball carry on long clearances by measurable distances prompting modelers to revise distance-to-goal metrics. Observers have seen these venue quirks appear consistently across multiple campaigns and data aggregators now tag such locations in their databases so that handicap calculations reflect the localized physics rather than uniform assumptions.
Conclusion
Localized wind and temperature variations at European stadiums generate measurable impacts on ball flight that trajectory tracking systems capture and feed into handicap modeling processes. As datasets grow more detailed through continued monitoring in 2026 and beyond the adjustments applied to European markets reflect these physical realities with increasing precision.