25 Jul 2026
Throw-in Specialists Carving Overlooked Edges in Possession-Driven Handicap Markets
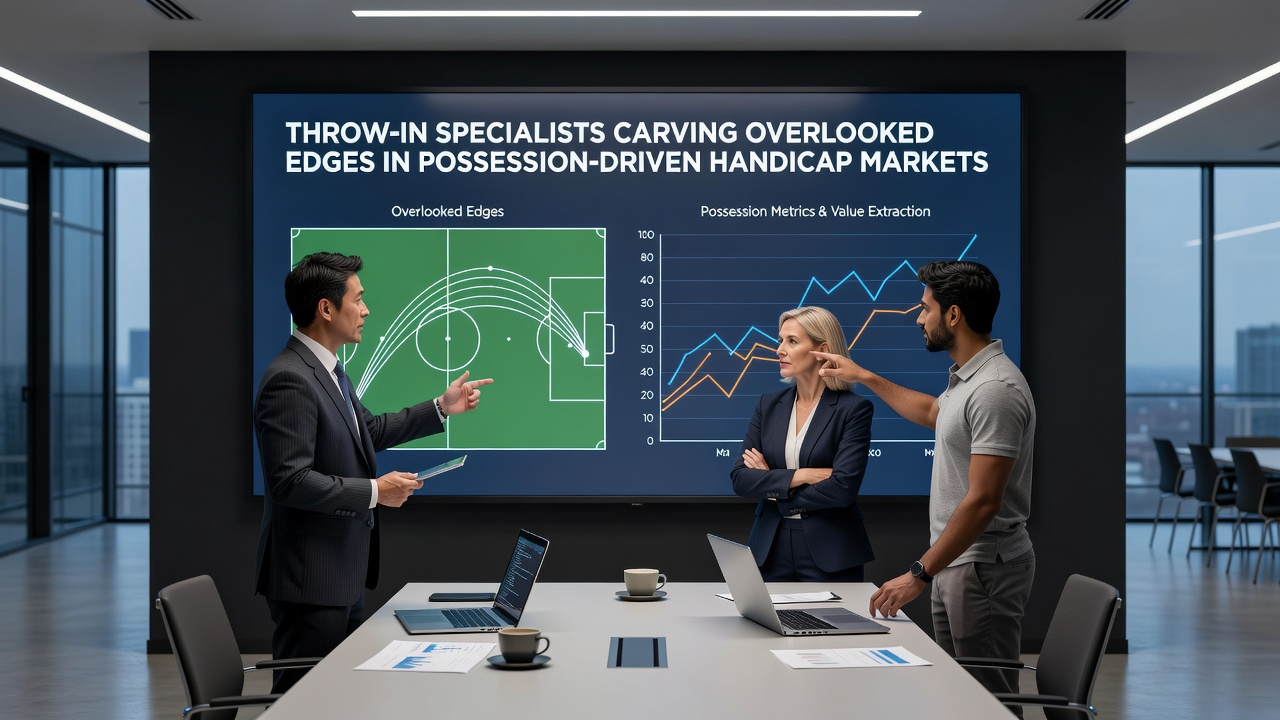
Throw-in execution has gained attention among betting analysts who track how possession-oriented teams convert these restarts into sustained pressure and goal opportunities that shift handicap lines. Data from major European leagues shows teams averaging over 25 throw-ins per match in the 2025-26 season, with accurate long deliveries correlating to higher expected goal values in the subsequent 30 seconds of play according to tracking providers.
Mechanics Behind Throw-in Influence
Specialists who deliver the ball 30 meters or more into attacking zones create numerical advantages similar to corner kicks yet receive less market scrutiny in handicap calculations. Researchers at sports analytics firms have documented that such throws lead to 12 percent more shots on target when the receiving team maintains possession beyond the first contact, a figure that directly feeds into live betting adjustments during matches where possession dominance already favors one side.
Coaches in top divisions now designate specific players for these duties based on arm strength, accuracy under fatigue, and decision-making speed, patterns that emerge most clearly in fixtures where both teams prioritize build-up play over direct attacks. Observers note that in July 2026 pre-season data releases, several clubs reported dedicated throw-in drills occupying up to 15 percent of training time, reflecting the tactical weight placed on this set-piece variant.
Market Pricing Gaps in Handicap Lines
Handicap markets that focus primarily on open-play possession percentages often undervalue the incremental edge generated by elite throw-in takers, especially in games where one side controls territory but struggles to break down compact defenses. Figures from industry reports indicate that teams featuring a recognized long-throw expert have covered adjusted Asian handicap lines at a 3.2 percent higher rate than comparable sides without such a player during the previous campaign.
Regional Variations and Data Sources
European competitions display the clearest patterns because of higher throw-in frequency in possession-based styles, whereas South American leagues show different distributions tied to more physical challenges. A study published by the Australian Sports Commission examined 180 matches across multiple continents and found measurable differences in how throw-in success rates translated to goal probability changes, particularly when combined with high pressing triggers.
Betting exchanges record sharper line movements in the minutes immediately following a long throw that retains possession, suggesting professional traders have begun incorporating this variable while recreational markets lag behind. This timing creates windows where informed positioning on team handicaps can exploit slower adjustments.

Integration With Broader Tactical Trends
Possession-driven teams that also excel at throw-ins gain a compounding advantage because these restarts restart the clock without resetting defensive structures the way goal kicks or free kicks do. Analysts tracking 2026 World Cup qualifiers have highlighted several South American squads that improved their handicap performance metrics after introducing specialist training regimens, with one nation increasing its average territory retention by 8 percent in matches featuring frequent throw-in sequences.
Opposition scouting reports now routinely include throw-in delivery maps alongside passing networks, a development that has begun filtering into pre-match line setting by bookmakers who adjust margins accordingly. Those adjustments remain inconsistent across different operators, leaving measurable discrepancies that surface most often in midweek European fixtures where squad rotation alters the availability of the designated thrower.
Tracking Tools and Future Developments
Advanced wearables that measure throw velocity and spin have entered training environments, providing quantitative benchmarks that replace subjective assessments of who should take set restarts. Data aggregated from these devices shows elite performers maintain consistent distances above 28 meters even in the 80th minute, a stamina factor that influences second-half handicap swings in games that remain level or within one goal.
Industry organizations such as the Sports Market Analytics Consortium continue to publish quarterly updates on restart efficiency, and these reports have started referencing throw-in contributions more prominently as possession models grow more granular. The resulting datasets allow handicap traders to refine simulations that previously treated all restarts as roughly equivalent events.
Conclusion
Throw-in specialists continue to generate measurable edges in possession-heavy matches where handicap markets have historically priced restarts uniformly. As tracking technology improves and more clubs formalize training around this skill, the gap between informed and standard pricing appears likely to narrow gradually through the remainder of 2026. Observers monitoring these trends can follow updates from technical reports and league analytics platforms that increasingly isolate restart data for separate evaluation.